
The Problem
When the Load Generator Becomes the Bottleneck
TL;DR — I built a distributed load-testing platform (test-scale) and used it to push a target service toward 2,000 requests/second. When I over-provisioned the load generator to find the target’s ceiling, the result looked like a broken backend — collapsed throughput, thousands of errors, a multi-second latency tail — but was actually my own tool saturating the shared host. After right-sizing the worker pool, the same target measured clean: 1,900 req/s at 8 ms p95 and 12 ms p99, with 2 errors out of ~57,000 requests (~0.004%).
The whole thing is a reminder that in performance work, the measurement instrument is part of the system you’re measuring.
The goal
Every load test starts with a number you want to reach, and a number you want to stay under.
- Throughput target:
2,000 req/s sustained. - Latency budget:
a p95 that doesn’t climb as load increases. - Error budget:
effectively zero.
The service under test was a trivial HTTP endpoint (an nginx mock target returning 200). The interesting part was the tooling: rather than hand-provision a fleet of load generators, I wanted a system where you write a YAML plan, and the platform figures out how many workers you need and scales them up on demand.
# test-plan.yaml
target_url: http://mock-target
ramp_pattern: constant
target_rps: 2000
duration_sec: 30
What the tool is, in one diagram
test-scale is six components that cooperate through a job queue:
CLI / UI
   │  submit plan (YAML)
   ▼
Control Plane (Gin API + Orchestrator) ──► Postgres (plans / runs)
   │  pre-scale workers
   ▼
Autoscaler ("Brain") ──► Worker Pool (scalable containers)
   ▲                          │  NATS: dispatch → register → start → report
   │                          ▼
   └──────── NATS ◄──────── Target Under Test
                              │  OTLP histograms + counters
                              ▼
                    Aggregator ──► Prometheus ──► Grafana
Three details matter for this story:
- The autoscaler is a static model, not a feedback loop.
It computes worker count up front as
ceil(target_rps / per_worker_rps)
, with a default
per_worker_rps
of 500. A 2,000 req/s plan asks for
4 workers
— and the “Brain” scales the pool
before
the run starts, rather than chasing load reactively. - Each worker runs a cooperative throttle, not a firehose.
The load generator (
internal/worker/load.go
) spawns
targetRPS/10
goroutines (capped at 50), and each goroutine loops: send a request, record the latency, then sleep for
interval = concurrency / targetRPS
seconds. - Percentiles are merged, not averaged.
You can’t average p95 across workers and get the platform’s p95. Each worker emits OTel histogram buckets, and the aggregator (
internal/metrics/histogram.go
) sums bucket counts across all workers before computing percentiles. That’s the part most load tools get subtly wrong — and it’s exactly where this investigation pays off.
None of that is the point of this article, but it’s the machinery that produced the surprising result.
Hypothesis
The default calibration said 4 workers for 2,000 req/s. But I wanted to know where the target actually breaks, not just whether it survived the plan. So I pushed far harder: 40 workers and a 30,000 req/s plan — fifteen times the original goal.
The hypothesis was textbook: more generators → more pressure → I’d find the target’s ceiling. Latency would climb at some point, errors would appear, and that knee in the curve would tell me how much headroom the service really had.
I was confident in the platform. The autoscaler had computed the count, the workers were up, NATS was routing, Prometheus was scraping. The instrument felt solid. So when the numbers came back, I initially read them the way every engineer reads a bad load-test result: the service can’t handle it.
The unexpected result
At 30,000 req/s across 40 workers, the run degraded badly:

Figure 1 — Throughput peaks, then collapses, before the target ever becomes the limiting factor. The test requests 30,000 req/s, but the generator peaks around 22,000 and then collapses to near-zero, averaging only ~10,500 req/s (35% of the request). The divergence between requested and achieved throughput is the first sign that the load-generation environment — not the target — is the bottleneck.
The throughput curve was the giveaway. A healthy test climbs to the requested rate and holds it flat for the duration. Instead, the generator briefly reached ~22,000 req/s and then fell off a cliff to ~0. The final report ; 10,481 req/s achieved, 4,000 errors, p99 of 5.6 seconds was real, but it wasn’t measuring what I thought it was measuring. It described the behavior of an overloaded generator, not the capacity of the target service.
Just to be sure the collapse wasn’t a fluke, I re-ran at 24,000 req/s. Same shape: ~11,000 req/s achieved, 4,000 errors. The ceiling reproduced.
Diagnosis: the generator became the bottleneck
Two charts told me where to look. First, the latency:
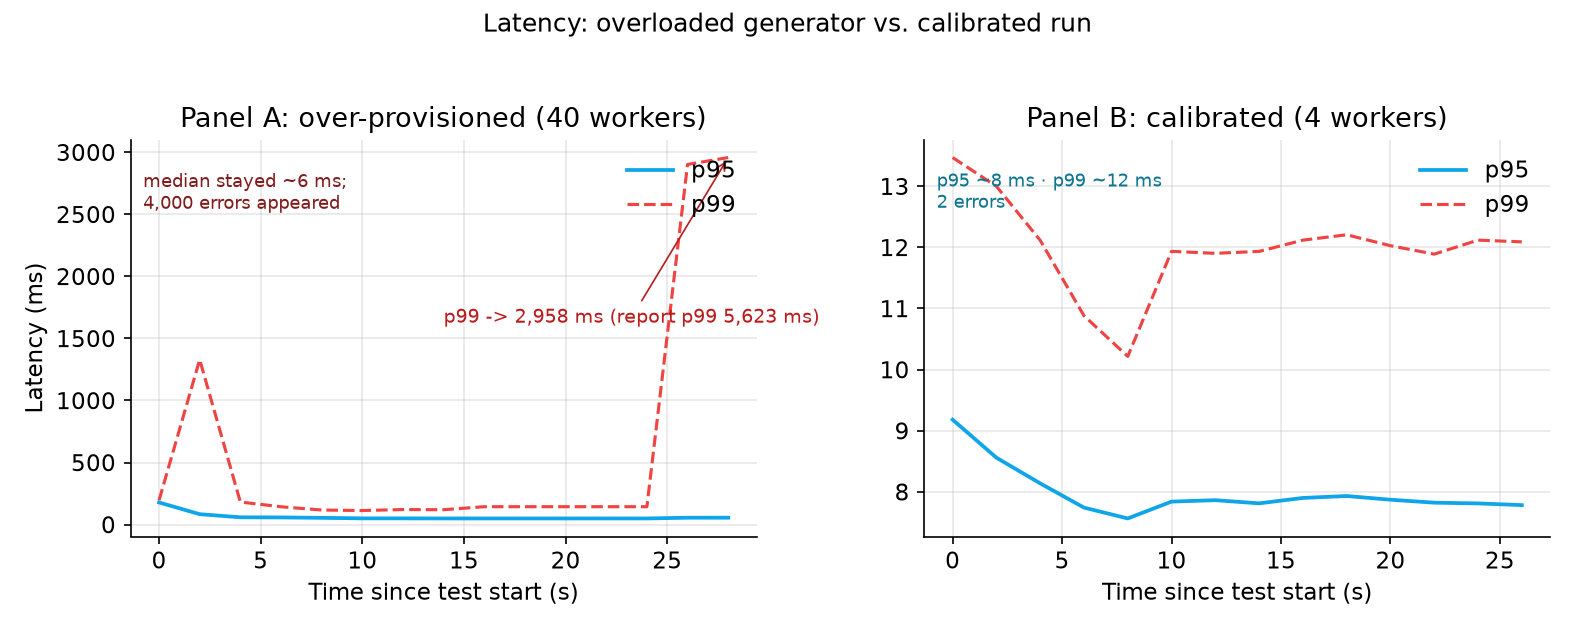
Figure 2 — The latency degradation disappears when the generator is no longer oversubscribed. In the 40-worker run (Panel A), the median stayed a healthy ~6 ms and even p95 hovered around 50 ms — but the tail (p99) spiked to nearly 3 seconds and 4,000 errors appeared. In the calibrated run (Panel B), p95 sits at ~8 ms and p99 at ~12 ms with 2 errors out of ~57,000 requests. The original “degradation” was not evidence of target saturation; it was concentrated in the tail and the error count.
Notice what didn’t degrade: the median. p50 sat at ~6 ms the whole time. p95 stayed around 50 ms. Only the p99 tail and the error count blew up. That pattern is consistent with a system that’s mostly healthy but intermittently starved for resources — and the CPU data tells us where that starvation is happening.
Second, the CPU:

Figure 3 — The resource bottleneck is on the load-generation host, not the target. During the problematic run, worker-host CPU climbs to ~85% while the target service stays under ~10%. Combined with the throughput collapse and the latency tail, this indicates the generators exhausted their available compute before the target reached its own capacity limit.
The target — a trivial nginx returning 200 — was using single-digit CPU while the generator host was pegged. The workers weren’t hitting the target’s ceiling; they were hitting their own.
Here’s the mechanism, and it’s a classic distributed-systems footgun:
- On Docker Compose, “40 workers” means
forty container processes sharing one machine’s CPU cores
— 2,000 goroutines in tight loops on 10 cores. - Each worker’s load generator uses Go’s
http.DefaultClient
, whose transport keeps only a couple of idle connections per host. At high concurrency that can cause connection churn, adding further CPU and networking overhead on top of the already-contended host. - As the host saturates, the throttle loop’s timing drifts, requests time out, errors pile up, and the cooperative limiter falls apart — throughput collapses.
I had literally documented this exact pitfall in the project’s README — “Workers max CPU/network before the backend does — you measured test-scale, not the app” — and then walked straight into it. Which, in hindsight, is exactly why you document things: the notes were right, and the experiment proved it.
The Solution
The fix: right-size the pool
The correction wasn’t to make the target faster. It was to stop asking the generator to produce load beyond what the environment could reliably sustain. For the original 2,000 req/s goal, the model’s four-worker configuration (ceil(2,000 / 500) = 4) was sufficient and, importantly, behaved predictably.
The deeper lesson is to not confuse a capacity model with measured capacity. The autoscaler’s per_worker_rps default is itself an assumption, and the generator isn’t free: it has its own CPU, network, and connection budget. Oversubscribing it produces numbers that look like target failure — and the way to avoid that is to keep the requested load inside what the environment can actually sustain.
The result
Same target, same request shape, right-sized pool:
| Configuration | Workers | Requested RPS | Achieved RPS | p95 | p99 | Errors |
|---|---|---|---|---|---|---|
| Over-provisioned | 40 | 30,000 | 10,481 | 57 ms | 5,623 ms | 4,000 |
| Calibrated | 4 | 2,000 | 1,900 | 8 ms | 12 ms | 2 |
The calibrated run delivered 1,900 req/s — 95% of the 2,000 target — at 8 ms p95, 12 ms p99, with 2 errors out of ~57,000 requests (~0.004%). That’s a number you can believe. It’s measuring the target, not the tool.
The tiny shortfall (1,900 vs. 2,000) is the honest gap between the throttle’s ideal rate and what the hardware actually delivers — the kind of discrepancy a trustworthy instrument should surface rather than hide.
What I’d want a reader to take from this
1. The observer is part of the system. In distributed load testing, the load generator is not a neutral probe. It has its own CPU, its own connection pool, its own ceiling. If you don’t know where that ceiling is, you can’t interpret anything on the other side of it.
2. Degradation in the tail, not the median. The median and p95 looked fine while the generator was melting down; only p99 and the error count told the truth. This is why the platform merges histograms rather than averaging percentiles — and why you should watch the tail, not the average.
3. Oversubscription masquerades as backend failure. The signature — collapsing throughput, a spiking tail, errors appearing — is identical to a real service degradation. The only way to tell them apart is to instrument both sides and cross-check: when the target is idle while the generators are pegged, you measured the wrong thing.
4. Calibrate before you scale. A static per_worker_rps is a model, and models are only as good as their inputs. The autoscaler did exactly what it was told; my job was to give it a target the environment could actually sustain.
Honest limits
This experiment proves a process, not a production guarantee. The 1,900 req/s number says the target handles that load from this environment. It doesn’t prove the target handles it from geo-distributed clients, through a CDN, under real concurrency patterns. The next step is scaling the generator across Kubernetes nodes (the project already supports KEDA) and treating single-host results as directional, not absolute.
It also surfaces a real gap in the tool itself: the worker’s HTTP client still uses Go’s default transport settings. Fixing connection reuse (MaxIdleConnsPerHost, connection pooling) is a genuine follow-up — not just for higher ceilings, but so the generator’s own ceiling is higher and better understood. That’s the discipline the whole exercise taught me: the load generator is the first thing you have to trust, and the last thing you should assume.
Built with test-scale — a distributed HTTP load-testing platform with YAML plans, autoscaling workers, and histogram-correct metrics.